My friend and I were walking on campus last week and came across a table with people in hot pink shirts promoting the Nike + “She Runs LA” 10K run and its associated after party to occur last Thursday night in the Nokia Theater at LA Live. It immediately peaked our interest because we would get two tank tops, two concert tickets, massages, hair and makeup done all for free at the event. So, we signed up and paid the registration fee on the spot. I went to the Nike website that night to validate my registration prior to the event as the representatives had instructed us to do. Needless to say my friend and I ended up having a great time. Nike did a splendid job integrating its marketing efforts and driving people to their website as a central location for its campaigns and brand identity.
Within the span of twenty-four hours Nike grabbed my attention again. I definitely chuckled the next day when I came across an article highlighting Nike’s creation of abstract art from feet. I thought, ‘could it be’? Long story short, to promote the new Nike Free Run+ QS City Pack shoe line they partnered with YesYesNo, an international interactive design collective, and designed a software to translate a runner’s route recorded through Nike + GPS into a personalized painting. Unfortunately, this software is not available to the public yet and a trial was only conducted at Nike internally. But, there’s more-
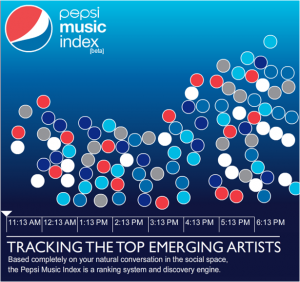
Nike is not the only company uniquely employing infographics, or the visual representation of data and information, into their integrated brand representation. One week prior to my discovering this newfound persona of Nike, we discussed the Pepsi Music Index in class. This index on the Pepsi website tracks the top emerging music artists’ trends online. Here, data is continuously collected and the viewer can personalize how this data is displayed (bubbles, bar graphs, line graphs).
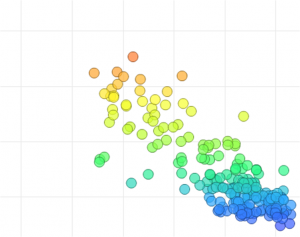
I found these examples fascinating and did my own search on how I could personally become a present day Picasso. I came across an article in Fast Company, “The 5 Best Free Tools for Making Slick Infographics”, that lists websites where anyone can upload a data set, or use previously loaded data, and transform it into artwork for their office, living room, or even a birthday. The library of data sets spans from U.S. state populations to the rate of flowers blooming this spring in an obscure small town. Since there has been so much buzz about the royal wedding, I decided to test my skills to create my own piece using a previously loaded set of data on the website, generated through Google analytics keyword “Royal Wedding” for the month leading up to Prince William and Kate Middleton’s wedding.
Here it is: Ta-da!
 Need a fresh piece of artwork? Try out these websites listed within the FastCompany article:
Many Eyes
Google Public Data Explorer
Hohli
Wordle
Visual.ly


3 Responses to Framing Footsteps & Fairytales